David Pan
Chairman, World Ranking, Inc. (2023-26)
Alma mater:
Penn, MUSA'21
RE Domain specialization
Alum connections: yrpan@alumni.upenn.edu
Biz partnerships: realyrpan@outlook.com
Official Profile & Portfolios
The Bestiary of Higher Dimensionals (2025)
The Bestiary is a compendium of the multivolume original works of Y.R. (David) Pan still in progress (2021 to present).
Current Stage of Excavation: Ancient Knowledge ⇒ Forbidden Knowledge

Catalogue of Contemporary Reality Distortions (2021-)
A Piece of Y.R. Pan’s Project Prometheus Fire

Rank The Globe™ (2023-25)
Rank The Globe™ by World Ranking, Inc. is the world’s most transparent consumer protection companion app: consumer rankings & ratings, chats, social games and more.
Quickstart Guide of Rank The Globe™

David’s Portfolio of Conceptual Art & Design
Selected original artworks of David span acrylic paintings (e.g. the mythic golden eagle), sketches (e.g. the maglev car), and digital models (e.g. the future city)


David’s Portfolio of Spatial Informatics, GIS & RE Financial Modeling (Archived)
Note: Below is an archived page of David’s Professional/Academic portfolio.
Disclaimer: By downloading, accessing or using any content from this website, you agree that you are doing so at your sole risk, and for educational purposes only
Section Navigation:
- Sample Corporate Projects - Part I
- Spatial Informatics & GIS Modeling - Part I
- RE Financial Modeling
- Spatial Informatics & GIS Modeling - Part II
Selected Corporate Projects & Exhibits
- Southlake HealthGAP Web App, Region: Province of Ontario (entirety), DV: ED Usage Rate, (pipeline programmed in Python, VBA), 2024—Present
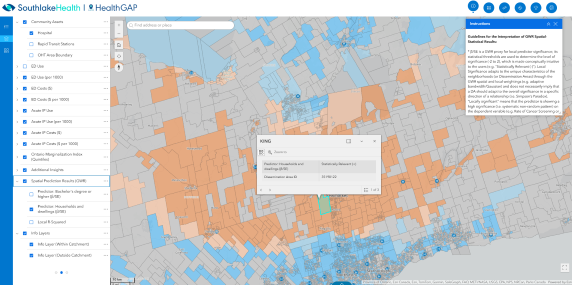 David’s automated pipeline runs from the pre-processing of raw data (e.g. auto -cleaning, -partitioning and -formatting of raw census data, raw PCCF txts, raw database extracts..), through the advanced ETL and spatial predictions, to the mass display configurations; which has shortened Southlake’s Spatial Analytics’ primary workflow from weeks in length to a single day. The high-utility Southlake HealthGAP Web App, which depends on this pipeline, comes readily furnished with 70+ insightful indicators, spatial predictions, and more.
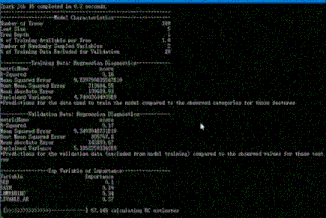
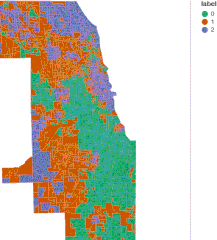
- Southlake-Ontario Health Test of Change (deployable provincially), Region: SCOHT Area, DV: Cancer Screening Rate (pipeline programmed in Python), 2022-2023 Selected as the “gold standard” by the Ontario Government from across a number of AI comparables, David’s automated pipeline enabled the automatic GWR modeling of any designated urban region, which resulted in local predictor significance (adaptively classified by the proxy statistic β coefficient/SE). β/SE is a GWR proxy for local predictor significance; its statistical thresholds are used to determine the level of significance (-2 to 2), which is made conceptually intuitive to end users (e.g. “Statistically Relevant (+ or -)”); Positively correlated (+): e.g. + income, + screening rate; Negatively correlated (-): e.g. + income, - screening rate. Local Significance adapts to the unique characteristics of the neighborhoods (e.g. dissemination areas, block groups…) through the GWR spatial and local weightings (e.g. adaptive bandwidth/Gaussian), and does not necessarily imply that a DA should adapt to the overall significance in a specific direction of a relationship (i.e. Simpson’s Paradox). “Locally significant” means that the predictor is showing a high significance (i.e. systematic non-random pattern) on the dependent variable (e.g. Rate of Cancer Screening or Rate of ED Usage) at the given Dissemination Area in the given direction of a relationship (+ or -). In short, local interventions in such areas are deemed relevant with a high magnitude of effect relative to any predictors not deemed relevant/not selected. Study designs such as RCT trials, which account for temporal precedence and theoretical plausibility, could be then used to determine causal relationships, guiding actionable local interventions.
- Results Replicated - Region: East Toronto Unincorporated Area, DV: Cancer Screening Rate, 2022-2023 The models were tested, independently evaluated, and successfully replicated in another urban region, which produced adaptive results and new insights for policymakers; particularly worth noting was that urban areas were better generalized by the existing ONMarg Indicators than areas of suburban/rural setting. GWR performance also scales with the unit of measurement (generally, the smaller the better, e.g. block groups, if available, tend to produce more substantial results than dissemination areas)
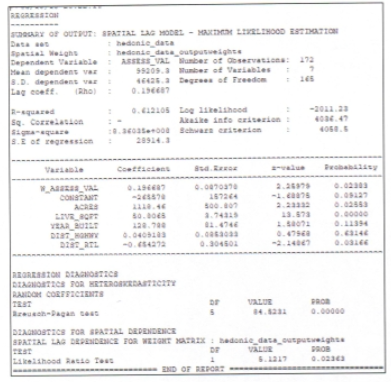
- Penn Exhibition Website: Urban Real Estate Valuation Tool (Standalone & Portable) (programmed in Python), 2021
 This adaptive spatial prediction model David designed allows RE investors to identify high-return RE investment opportunities in adjoining neighborhoods pending population growth in any designated urban region, in addition to generating reliable assessment figures for insurance companies and tax agencies (parameters such as regional inflation rate, 10-year risk-free interest rate, and construction cost psf can be auto-detected from the model inputs and plugged into predefined equations, given correct field names).
- Ontario Investment Office Interactive Web App, (programmed in Javascript), 2018
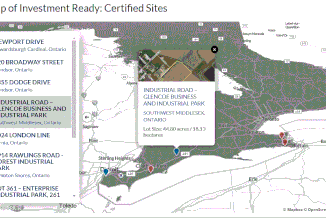 An example of an embedded interative web app built from scratch in JavaScript (JS), HTML and CSS by David. (note: there were slight modifications made by others in recent years).
- Spatial Statistics, Machine & Deep Learning Modeling Guide by David Pan (with in-built Excel selection tools)
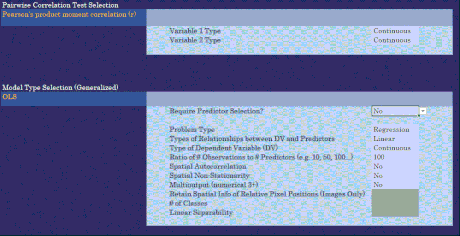 David’s automated model/test selectors + modeling guide, among other productivity tools, were previously published on the Ivy League Education website TSL. This popular free tool, a.k.a. the “Quick Stats Helper,” has educated and helped academics, students and professionals alike as they engage in statistical modeling/learning
Selected Spatial Informatics & Advanced GIS coursework (theoretical & real-world based)
at the MUSA program of the Weitzman School (2020-2021)
Python, JS, R and SQL are the primary languages used
Selected Advanced RE Finance & Investment coursework (real-world based)
at the Wharton School (2020-2021)
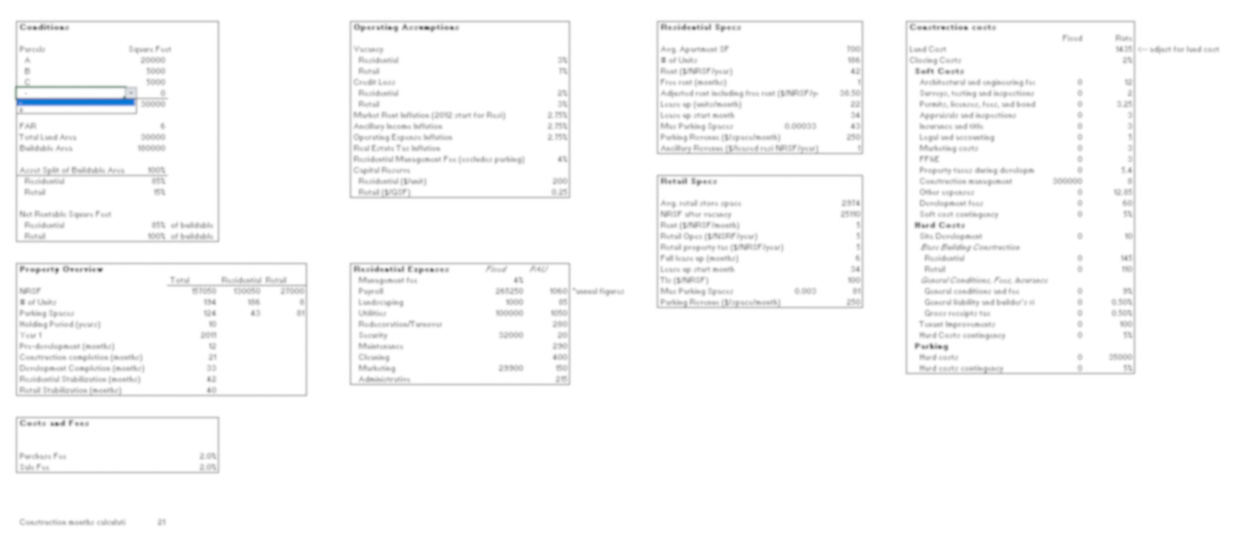
†Sharing of models is currently prohibited, please contact Wharton Real Estate Department for permission to view/evaluate
Selected Spatial Informatics & GIS coursework (theoretical)
at UWaterloo, Specializations: City Planning, GIS & Real Estate Development (2014-2019)
- SLUCE2 LMM ABM Lab Report/ Von Thunen Land Rent Model (software-based) - PLAN 416: Modeling the City

Other relevant Spatial Informatics coursework at Penn (theoretical & real-world based):
-
Global Real Estate Development Suitability Model (programmed in JavaScript) Dec 2020
-
Point Pattern Analyses (NN, K-Functions), Philadelphia, PA (programmed in R) Dec 2020
-
SLR Real Estate Damage Prediction Model for New York City, NY (programmed in Python) Dec 2020
-
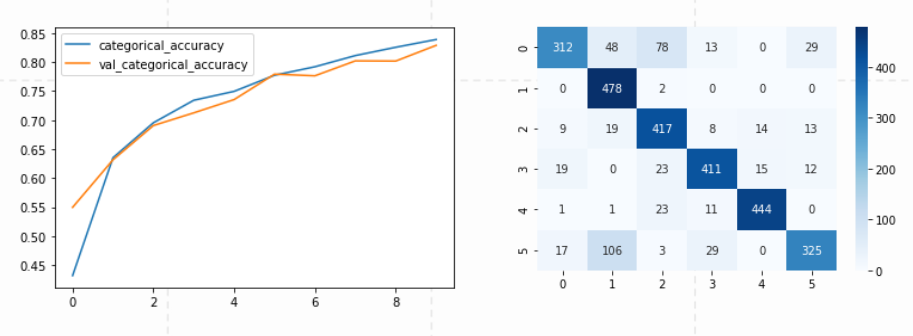
Machine Learning: Single-Family Home Price Prediction for Miami, FL (programmed in R) Dec 2020
-
NDVI and Urban Network Analysis, Philadelphia, PA (programmed in Python) Oct 2020 – Nov 2020
-
Global Cumulative Travel Cost Estimation (programmed in JavaScript) Oct 2020
DAVID’S PORTFOLIO OF SPATIAL INFORMATICS, GIS & RE FINANCIAL MODELING (© 2014-2021)